Studying how conversational context impacts AI responses across different models
We re-ran our study on conversational context across more models, more pathways, more prompts. The finding holds true: how a buyer frames their problem changes which vendor gets recommended.
TL;DR: Key Takeaways
- We re-ran our original study, analysing how conversational context influences AI responses across four models, with 10 runs per conversational path instead of three.
- The core finding replicates everywhere. How a buyer frames the problem early in a conversation changes the recommendation they get at the end, on every model we tested.
- There is less stability in the shortlist - the vendors brought into the conversation - than our initial study showed. Across the new data, shortlist stability drops from 0.82 to around 0.55, and that average hides a range from 0.10 to 1.00.
- Your visibility tracking averages away all this instability across different ICP segments, and conflates being “visible” (mentioned) with being “recommended”.
What we found the first time
A couple of months ago, we conducted a deep study to understand how conversational context shapes AI responses. We had a nagging sensation that the way we track AI visibility is deeply flawed; it treats each user prompt as an event, isolated from its context. We run a prompt and parse the results into a dashboard, assuming it to be an accurate reflection of what our buyers see in AI conversations.
But our buyers don’t run a single prompt. They have a conversation. And throughout that conversation, AI picks up context and criteria that shapes subsequent answers.
What we found really undermines the data most brands see in their prompt tracking dashboard. The way a buyer frames a problem early in an AI conversation carries through into the recommendation they get several turns later when asked for a vendor recommendation. What’s worse, it often doesn’t impact the shortlist.
Put simply, the same brands get mentioned. The same brands get cited. But the framing changes completely and the brand that is recommended completely changes. Your visibility dashboard logs a win - you were “visible” after all - while customers are pushed to your competitors.
How did we do it
We simulated multi-turn conversations across eight B2B categories, intentionally introducing different angles on the same overall topic.
We ran five sequential prompts per conversation, holding four of them constant and changing only the second, the "lens" through which the buyer read their problem. Across eight B2B categories on a single model, that lens (or “frame”) survived into the final answer (frame retention ratio 0.37, range 0.12 to 0.64), with sufficient weight to change the recommendation.
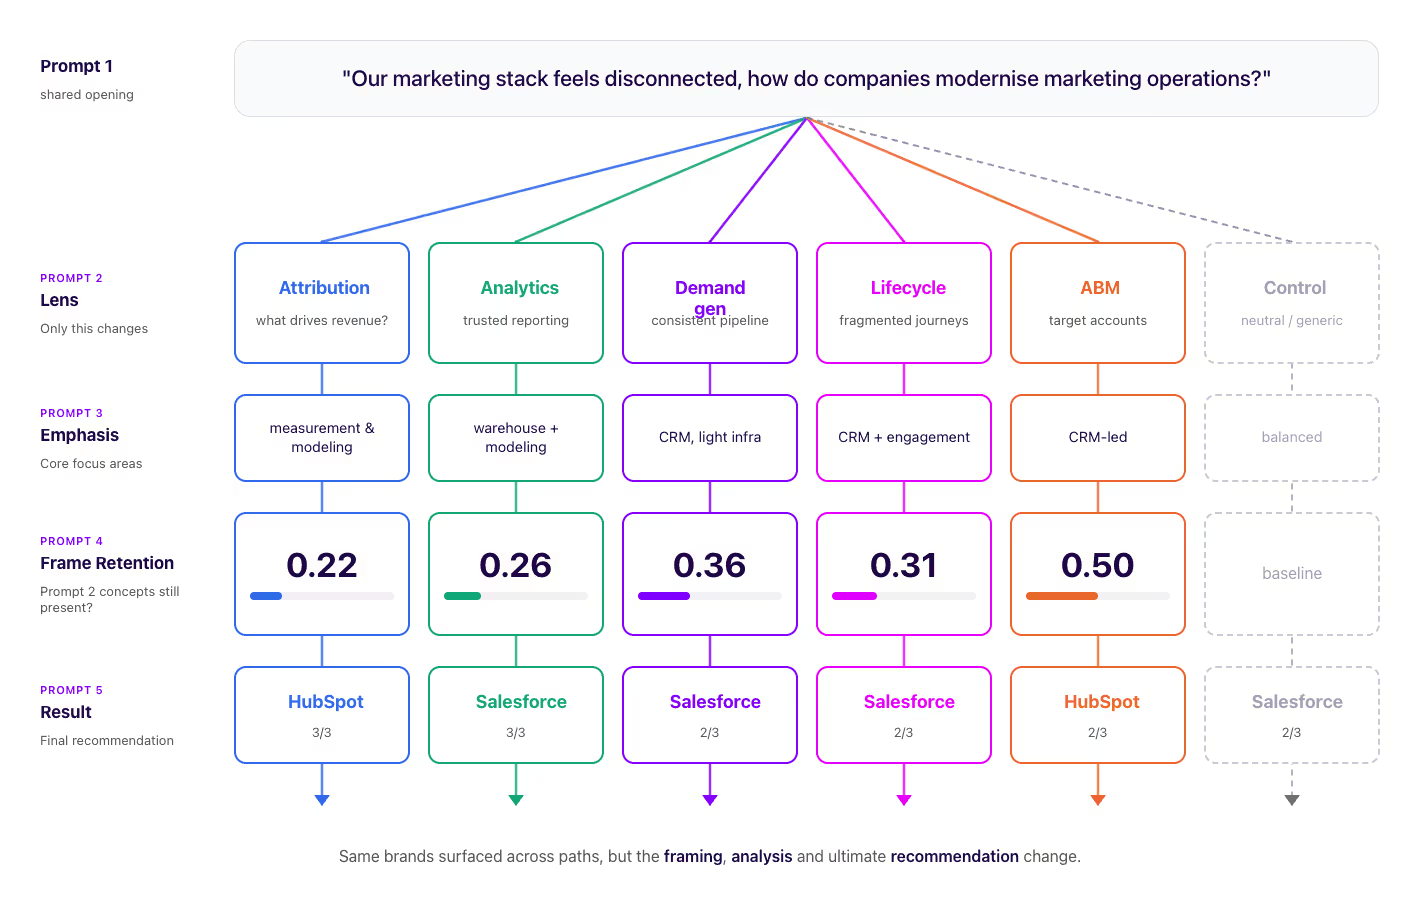
Take the CRM category. We tested 6 pathways, approaching the conversation from an attribution, analytics, demand-gen, lifecycle and ABM perspective alongside a generic control. Across each, Hubspot and Salesforce are visible. But when pushed for a recommendation, the outcome was split: 40% to Hubspot, 60% to Salesforce. Again, 100% of those pathways are logged as a “win” for both brands in a standard prompt tracking dashboard.
This means both brands are currently making major investment decisions off a completely flawed picture of how AI conversations are impacting their customers.
Before we made product decisions of our own off the back of this finding, we wanted to make sure, and we wanted to understand how this effect scales across some of the other major models. This article breaks down what we found when we dug a little deeper, and applied some more advanced mathematical analysis.
Note: We have intentionally not repeated or reiterated previous findings. Treat this as an addendum; the full original report can be found here.
Key Finding: This isn't a one-model or one-test fluke
In short, the pattern shows up to varying degrees across all four models (OpenAI GPT‑5.6‑terra, Anthropic Claude Sonnet 5, Gemini 3.7 Flash and Perplexity Sonar‑Pro) we tested.
Changing the buyer's lens changes the direction of the conversation, on every model, in every category.
When we analysed the responses using vector embeddings - a way of mathematically defining the meaning of an answer - 62 of 64 tests came back with a statistically significant shift. The phrasing of the response hadn’t just changed; it’s substance had changed.
While our original metric (frame retention ratio) tells us whether framing concepts from step 1 survive within a path to step 5, vector embeddings plot the end point of the different pathways against one another. FRR tells us AI remembered the initial framing at the end. Embeddings prove that the destination was altered materially.
That is what we expected; it’s how these systems are built. AI models are highly contextual and responsive to the nuances of a conversation. In our previous study (Dark AI) we observed a pattern called “intent matching”. Namely, as the intent of a prompt moves down-funnel from “exploratory” to “decisional” the response changes in tone and substance to match. More definitive, more brands named, and more opinionated to help the user make a decision. If AI models react so intelligently to implied or implicit user needs, it is hardly surprising that they would adapt to explicit criteria and context acquired in the course of conversation.
The Recommendation changes, but does the Shortlist?
I must admit, it feels a touch narcissistic to keep quoting our own studies but such is the nature of this piece. One conclusion of the original study was that “the shortlist stays the same, but the recommendation shifts completely”.
With a bigger dataset, this requires some nuance.
"The recommendation shifts" holds up completely. As outlined above, across every model and every category, changing the buyer's framing changes who wins.
"The shortlist stays the same" does not quite hold up as a blanket claim. Pooled across the new data, shortlist stability drops from 0.82 to around 0.55.
What these two numbers actually measure
Shortlist stability. For each conversational path, we take every vendor named in the response to prompt 4 and keep the five named most often across that path's 10 runs. Then we compare those five-name lists across the five lens paths within a category, and score how much they overlap. A score of 1.00 means all five paths produced the same shortlist.
Frame retention ratio. Each lens puts a set of ideas on the table early in the conversation: particular priorities, concepts and language. Frame retention asks how many of those ideas are still load-bearing in the model's final answer. If a lens introduced ten concepts and four are still present in the model’s final answer, retention is 0.4.
The data shows meaningful variation, by model and by category. Anthropic on Marketing Tech comes in at 0.87 - the shortlist stays the same. OpenAI on Publisher Monetisation comes in at 0.15, which is barely the same list twice. It appears to be as connected to the stability and maturity of the category as it is to a consistent model behaviour.
| Metric | Original (1 model) | New (4 models 8 categories) |
|---|---|---|
| Frame Retention Ratio | 0.37 | ~0.43 (0.33–0.49) |
| Shortlist stability across framings | 0.82 | ~0.55 (0.10–1.00) |
So, to refine the original insight: what's constant is the recommendation moving. Each buyer is pushed towards a different solution. What's not constant is whether the pool of solutions from which those recommendations are drawn changes. In some categories, there’s a narrow and consistent shortlist, with the “preferred solution” changing based on the user’s criteria. Some categories are more chaotic, with a big pool of solutions and completely different ones brought into each conversational pathway.
While 8 categories is not enough to draw firm conclusions as to what influences how that category behaves (something we plan to study further in future), it does appear to be linked to its maturity. Stable, defined categories (e.g. marketing automation solutions) feature a stable shortlist where more fluid or fragmented categories (e.g. publisher monetisation or AI-heavy categories) feature more variable shortlists, meaning your AI visibility will inherently be more unstable.
Again, across them all, the direction AI pushes buyers varies completely depending on the conversational context.
Variation across models.
The honest answer to "how much does this vary by model" is: not by much, and that's the point. Four different systems, built by four different labs, all materially changing the conversation based on the conversational framing. This is a behaviour that is intrinsic to a large language model, not any one model.
That said, there are some small but noteworthy variations in the strength of the different effects that we observed.
| Metric | OpenAI | Anthropic | Gemini | Perplexity | "All four" |
|---|---|---|---|---|---|
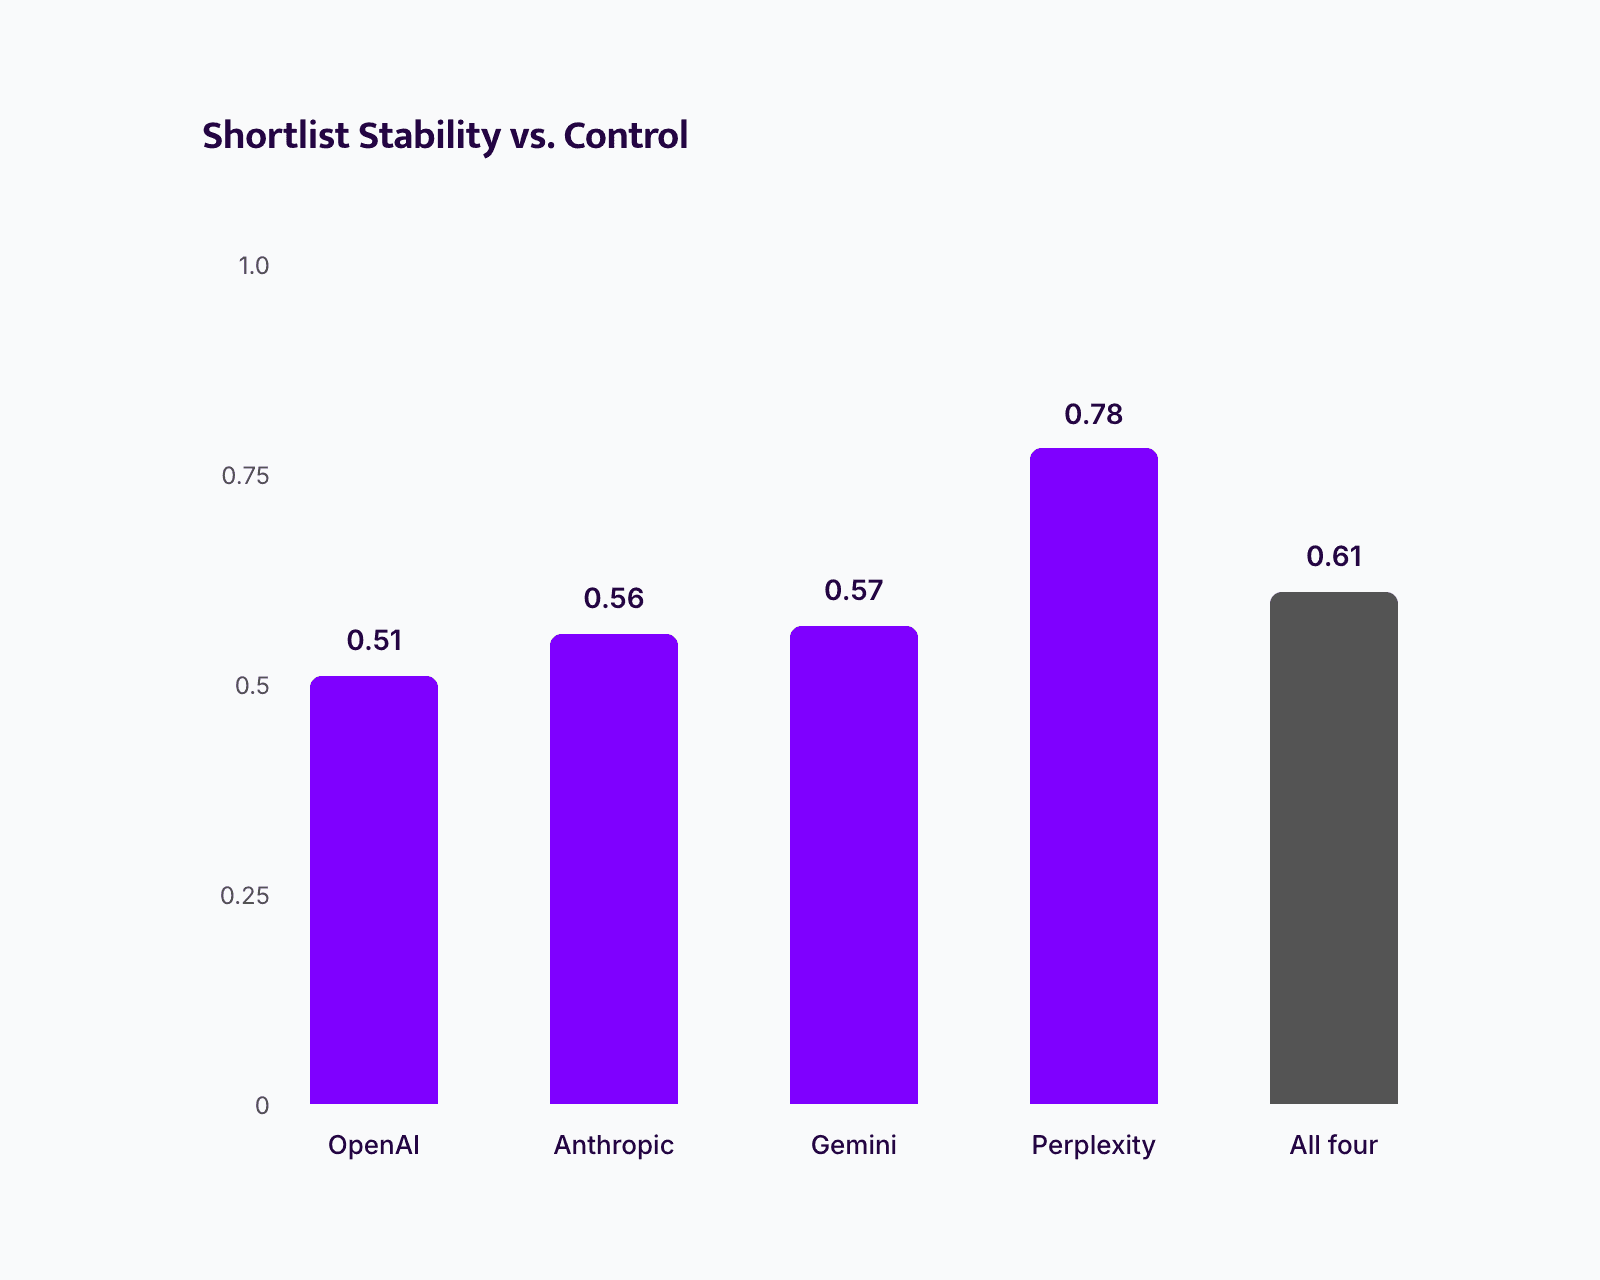
| Shortlist stability (vs. control) | 0.51 | 0.56 | 0.57 | 0.78 | 0.61 |
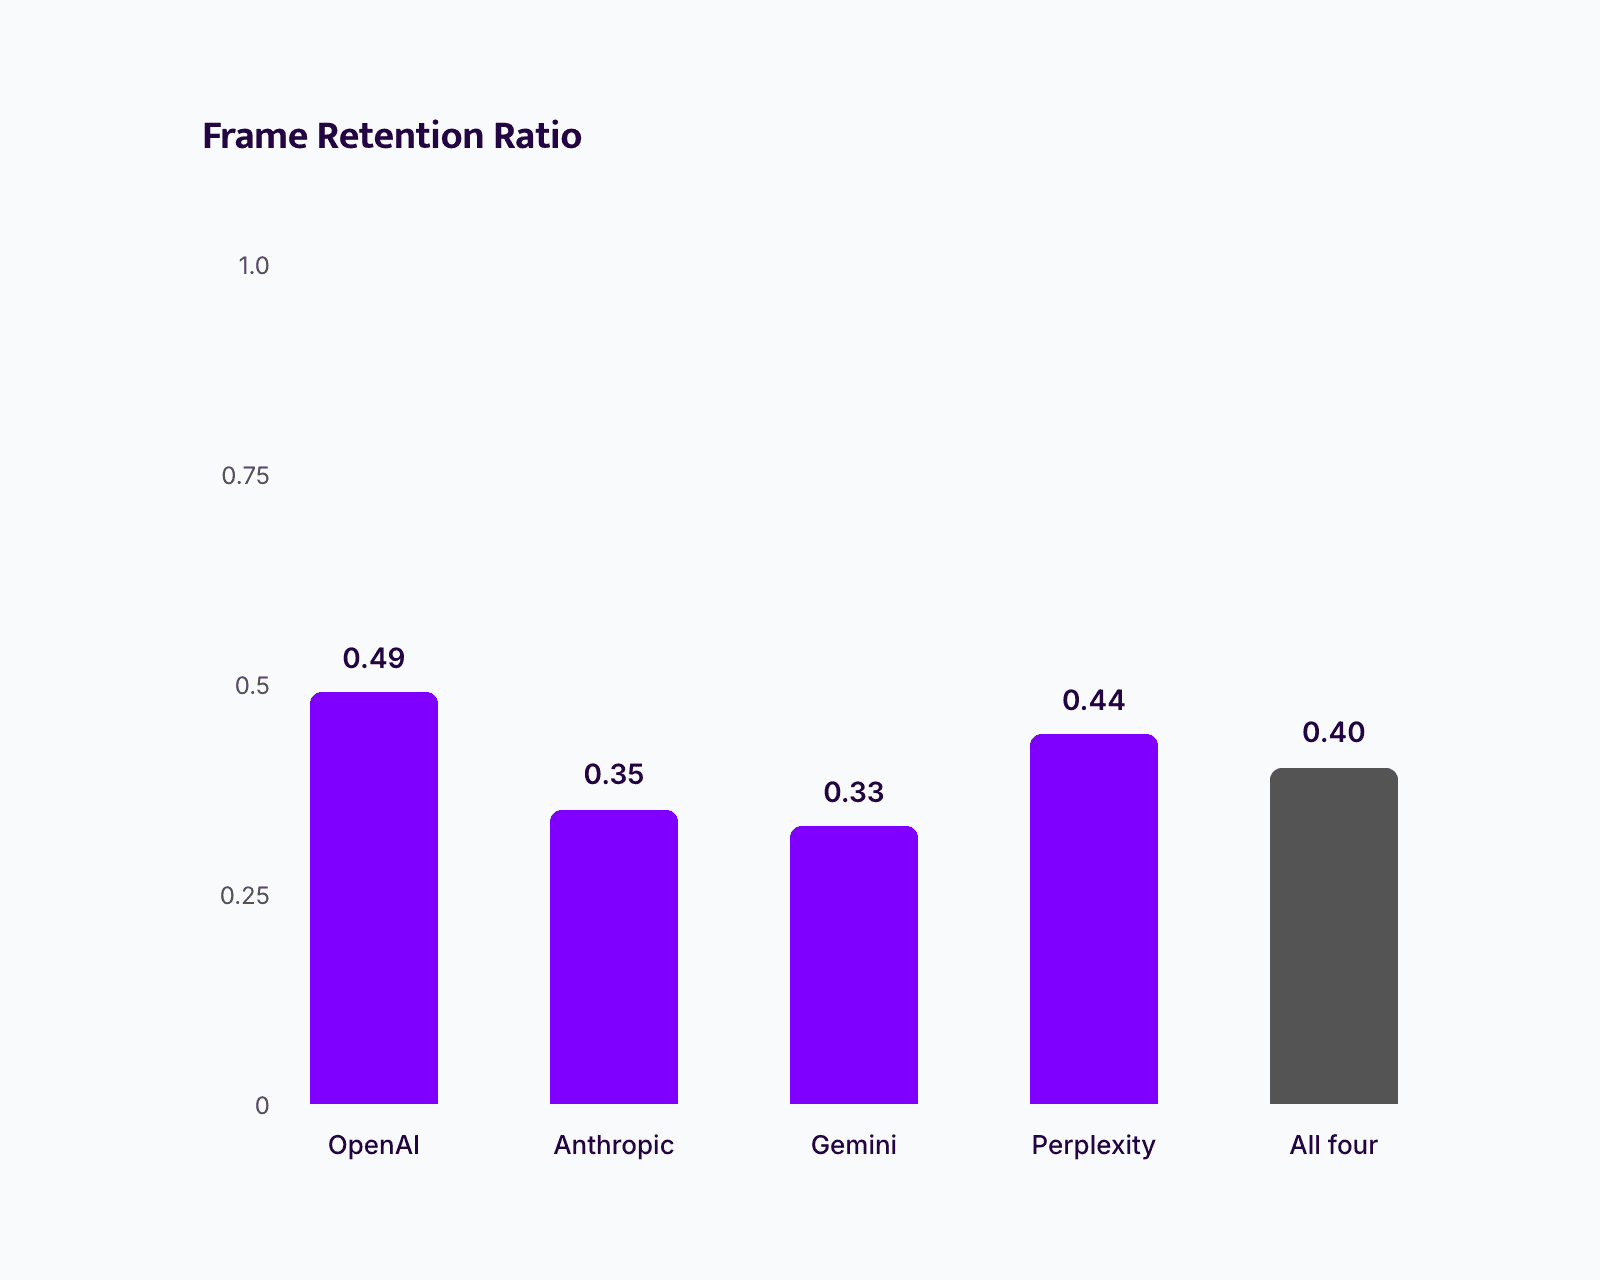
| Frame Retention Ratio | 0.49 | 0.35 | 0.33 | 0.44 | 0.40 |
| Answer displacement vs. control | 0.12 | 0.32 | 0.28 | 0.21 | 0.23 |
Shortlist stability is straightforward. It's asking: of the five vendors a model names most often, how many are the same five regardless of context? At 0.61 on average, that works out to roughly three of five staying consistent, with variation in two. OpenAI reshuffles the shortlist the most (0.51), Perplexity barely touches it (0.78, closer to four of five). With Perplexity as a slight outlier, the rest of the data sits within the bounds of natural variation.
Frame retention ratio measures how many key concepts are retained, on average, within each path. How many concepts introduced in Step 2 are still core to the response in Step 5. An average of 0.40 means less than half of what you told the model to care about is still visibly there by the time it answers. This is relatively consistent across all models (0.35 to 0.49), and while “less than half” may not sound like much, it is meaningful and as the study shows, plenty to change the direction a buyer is pushed in terms of a vendor recommendation.
Displacement is the one that needs more analysis, because 0.12 and 0.32 don't mean anything on their own. This metric measures how far a pathway’s final response sits from the control. 0 would mean the two texts are the same idea said broadly the same way, and higher means the model went somewhere genuinely different.
To give you some context, we asked the same question with the same prompts ten times and measured how far apart two runs of the identical control conversation land, purely from the model's own variability. That baseline sits at roughly 0.17. Second, we measured the distance between two answers on completely unrelated topics, for example a marketing-stack recommendation against an AI-strategy recommendation. That's roughly 0.66.
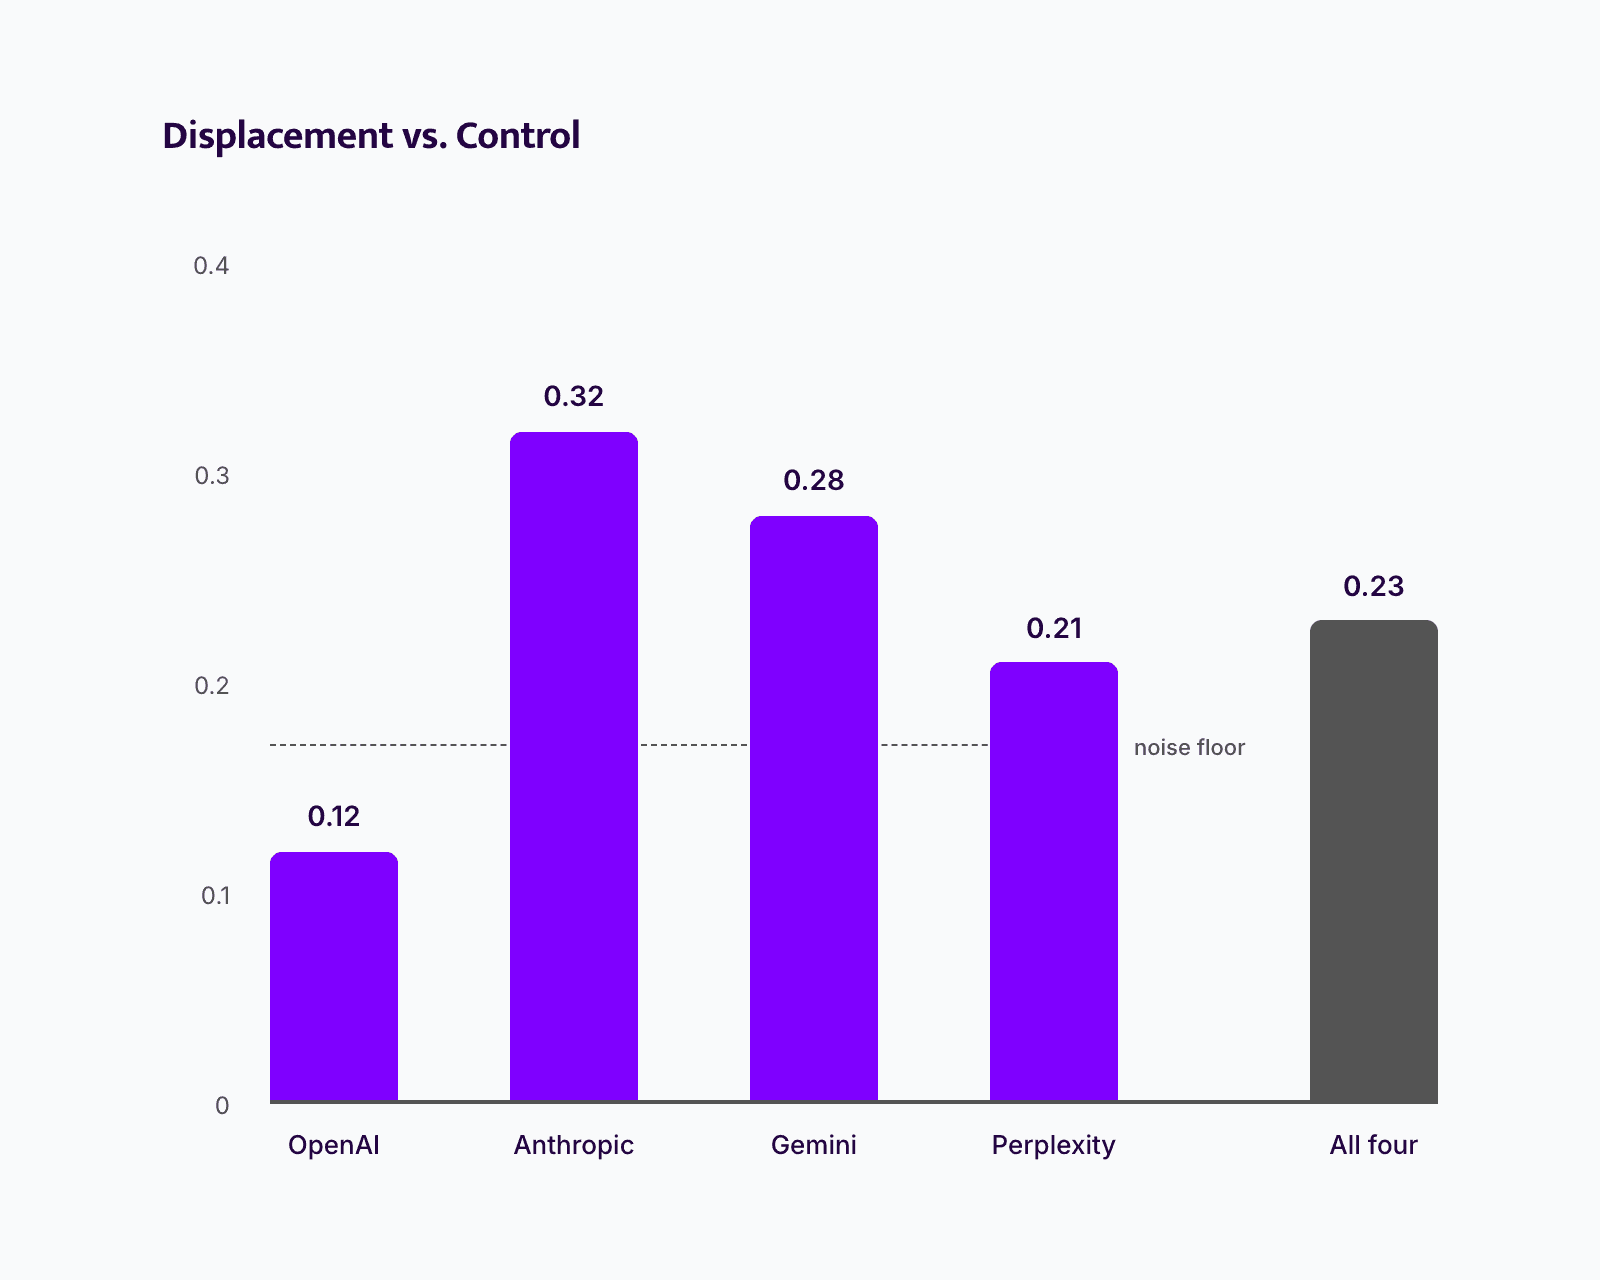
So we can treat 0.17 as our “floor” - the point at which variance could just be the natural variance inherent in LLM responses. And 0.66 as our “ceiling” - two completely unrelated answers.
Against that scale, OpenAI's 0.12 sits at, or just under, the noise floor - it’s difficult to say for sure that the substance of their answer changes beyond what could be considered natural variation. Anthropic's 0.32 sits about a third of the way to "different topic".
The framing effect isn't a single phenomenon or behaviour that behaves the same way everywhere. All these models behave very differently across conversations, with the only real constant being that volatility. This is what makes tracking AI visibility so challenging, and the current approaches the industry has begun to take for granted (run prompts, track citations, repeat) so deeply flawed.
What this means for measurement
If framing changes the story more reliably than it changes the shortlist, then tracking "are we mentioned, yes or no" is deeply flawed. That metric can't tell you whether you're being recommended to the right buyer for the right reason. You are tracking visibility and treating it as a “win”, while your buyers are being sent to a competitor.
It therefore follows that you must track visibility specific to each ICP or persona. AI is contextual; it picks up criteria over the course of a conversation and completely changes its responses as a result. It’s important to replicate your buyer’s context in your visibility tracking, to make sure you’re building a strategy on what your buyer sees, not what random ChatGPT users see.
It’s also important to apply what you know about your category. Shortlist stability ranges from 0.10 to 1.00 across our eight categories. It’s useful to understand, or hypothesise, as to how this impacts your category to inform how you invest in and measure AI performance. Are you in an unstable and fluid, emerging category where stability is low and visibility uncertain? Or a fixed, mature category where it’s largely predetermined? This impacts the potential opportunity of GEO as a “channel” and how you go about capturing it.
This matters most for specialist B2B brands. Generic AI visibility tools tell you what your average, logged out ChatGPT user sees. For most B2B brands, that not who you want to reach; you’re targeting niche, specialised buyers with specific use cases. The more specific the buyer’s intent, pain points, criteria and context the further your customer’s real experience in AI conversations diverges from what your visibility dashboard is showing you.
Following this research, we completely rebuilt our AI visibility tracking. It operates on a segment-by-segment basis, to give you complete control over the context you are simulating when you assess AI performance. Even then, each buyer’s response will be different. Our commitment is to continue to build and rebuild our product as our research yields new learnings. Even when it’s inconvenient. Which I must say, this really was.
Methodology
How we built this
Methodology
Design. Eight B2B categories. Five conversational lens paths plus one neutral control per category. Four models: OpenAI GPT‑5.6‑terra, Anthropic Claude Sonnet 5, Gemini 3.7 Flash, Perplexity Sonar‑Pro. Ten runs per path, 1,880 conversations in total. Each conversation runs five sequential prompts; prompt 2 is the lens that varies by path, the rest are shared within a category.
Limitations
Ten runs per path (per category) is a real improvement on three, but it is still a sample.
Shortlist stability compares five-name lists, so a vendor moving from fifth to sixth place registers as a change of the same size as a category leader disappearing. The metric is blunt about where in the list the movement happens.
Vendor detection is dictionary-based. A vendor we didn't list is a vendor we didn't count. The categories furthest from established software markets are the ones where that might be relevant, but not material to the overall conclusions.
We measure what the models produce. We don't measure what buyers do with it. Nothing here shows a buyer changing their decision, only the model changing what it puts in front of them. Buyer behaviour with AI remains the biggest unknown in all this.
Reproducibility. Raw transcripts for all 1,880 conversations and the analysis code are available on request. Email tom@demand-genius. We encourage anyone to reproduce or further extend our experiments!
Related
More from the research team
.png&w=1920&q=75)


Want this applied to your brand?
Book a free audit. Real analysis of your AI position, no obligation.